")
")
Transforming Data Into Relevant Visuals — Powered by Microsoft Power BI
Elevate your Power BI dashboards with our custom visuals.
Looking for innovative ways to showcase your data? Our intuitive and customizable visuals will revolutionize your reports, making them more functional and user-friendly.
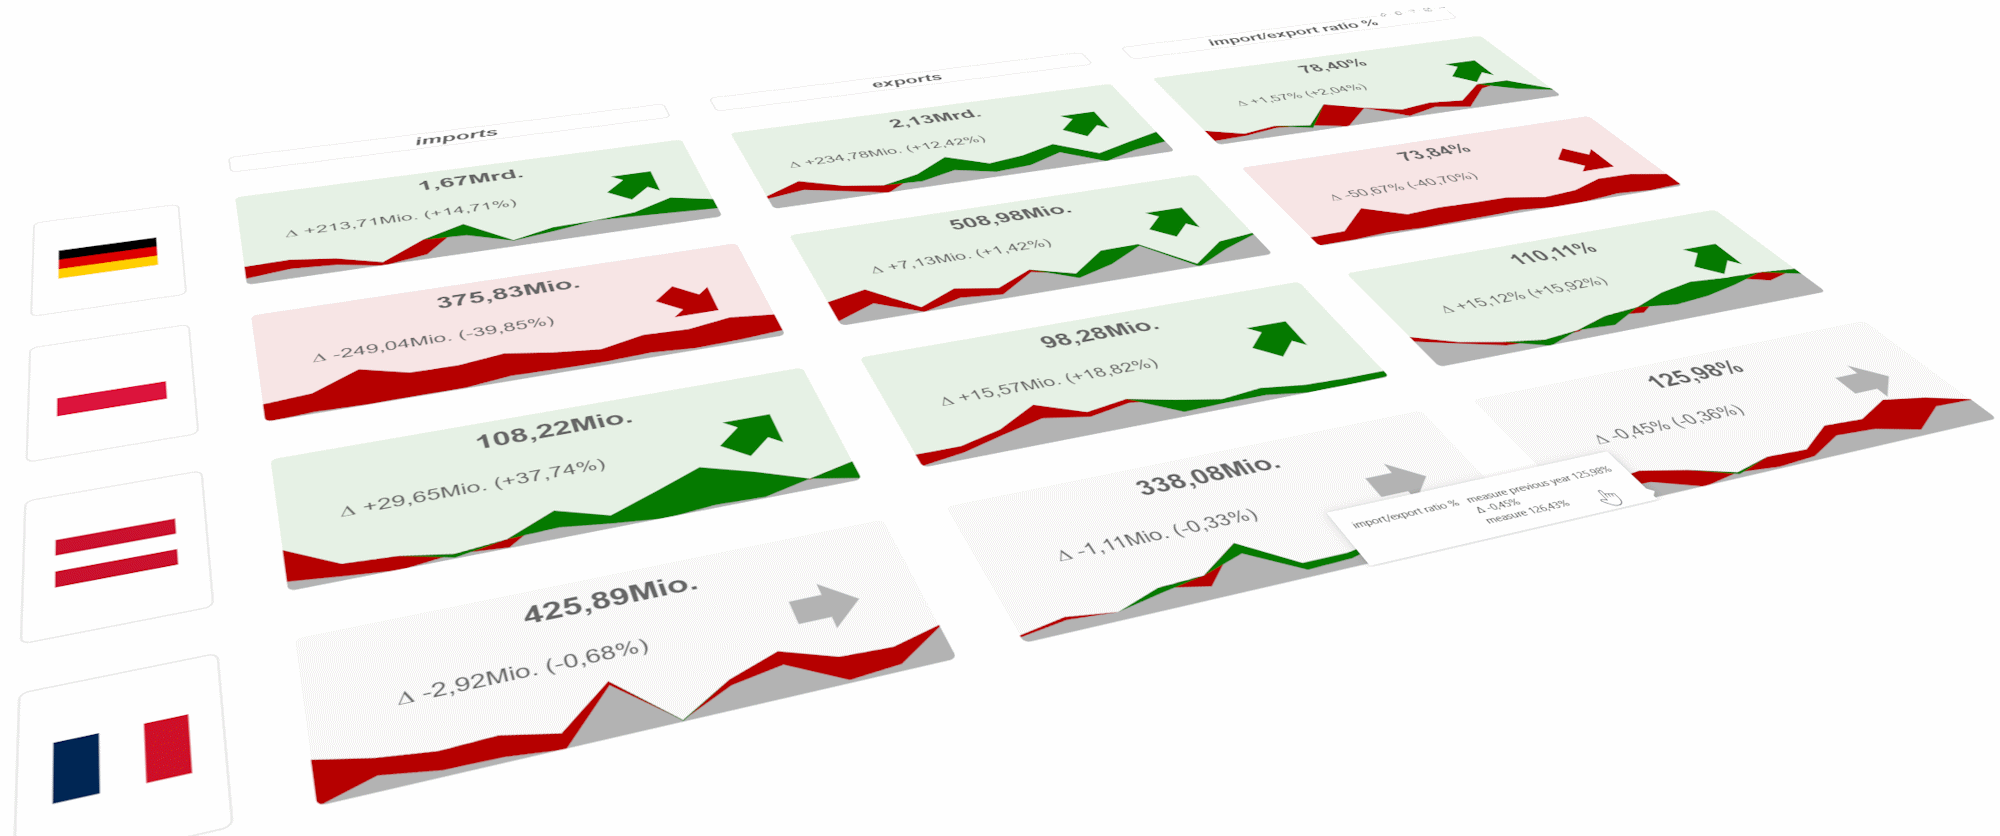
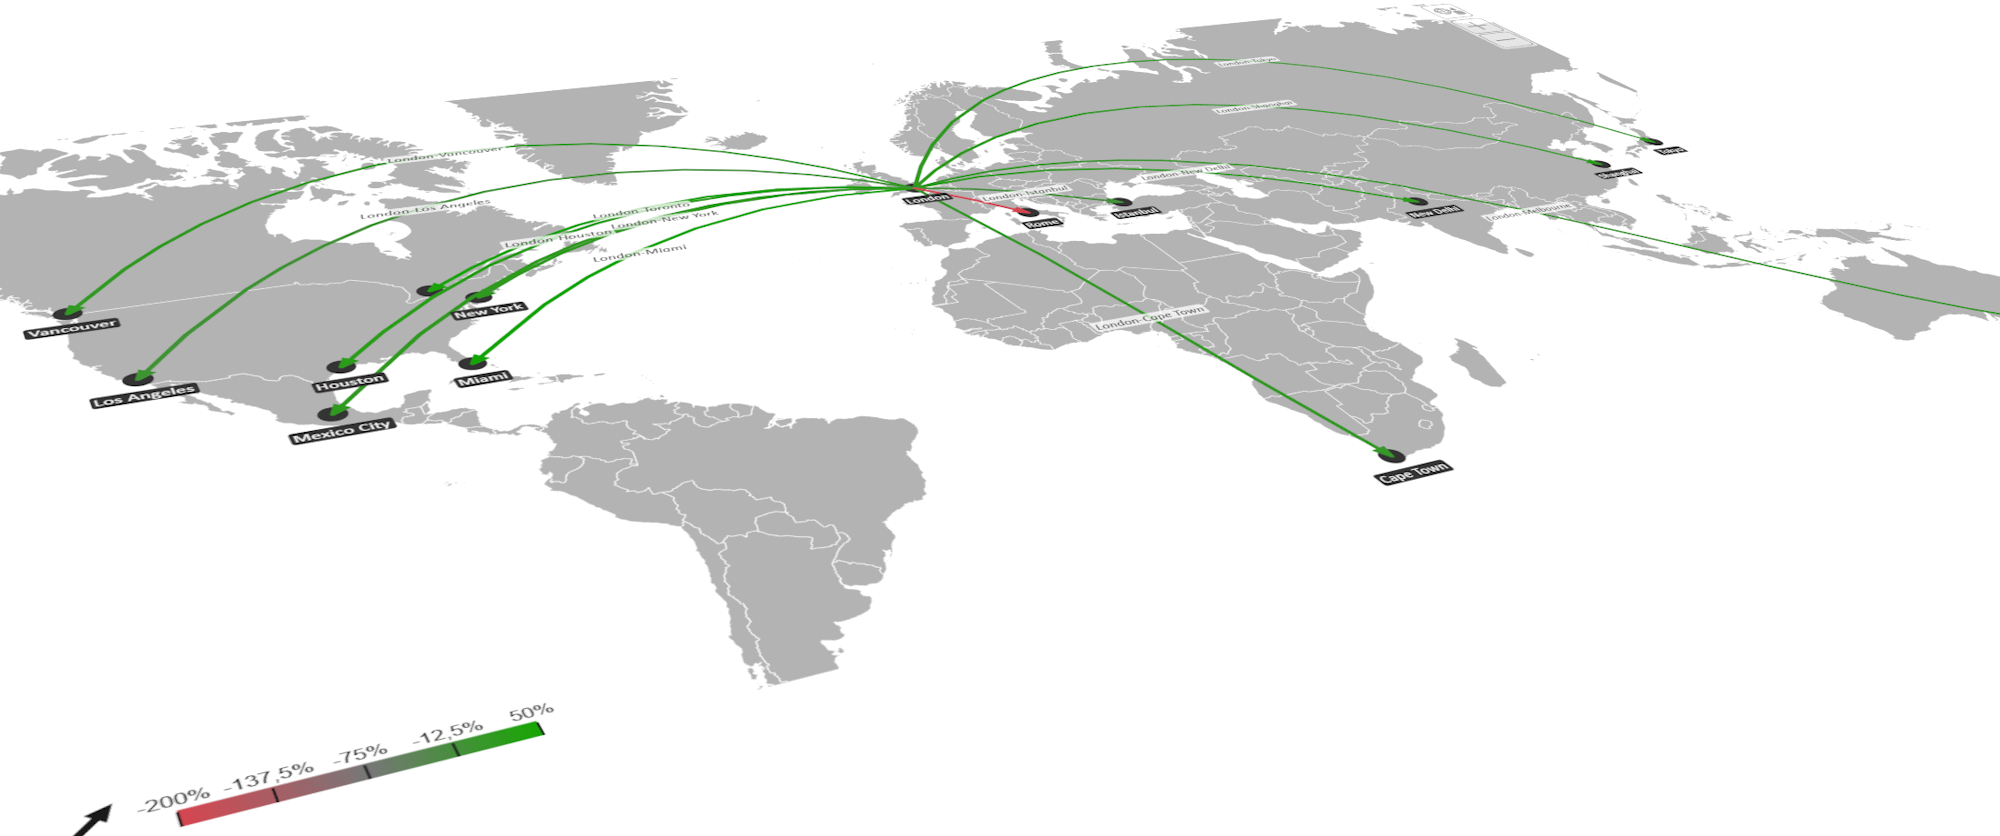
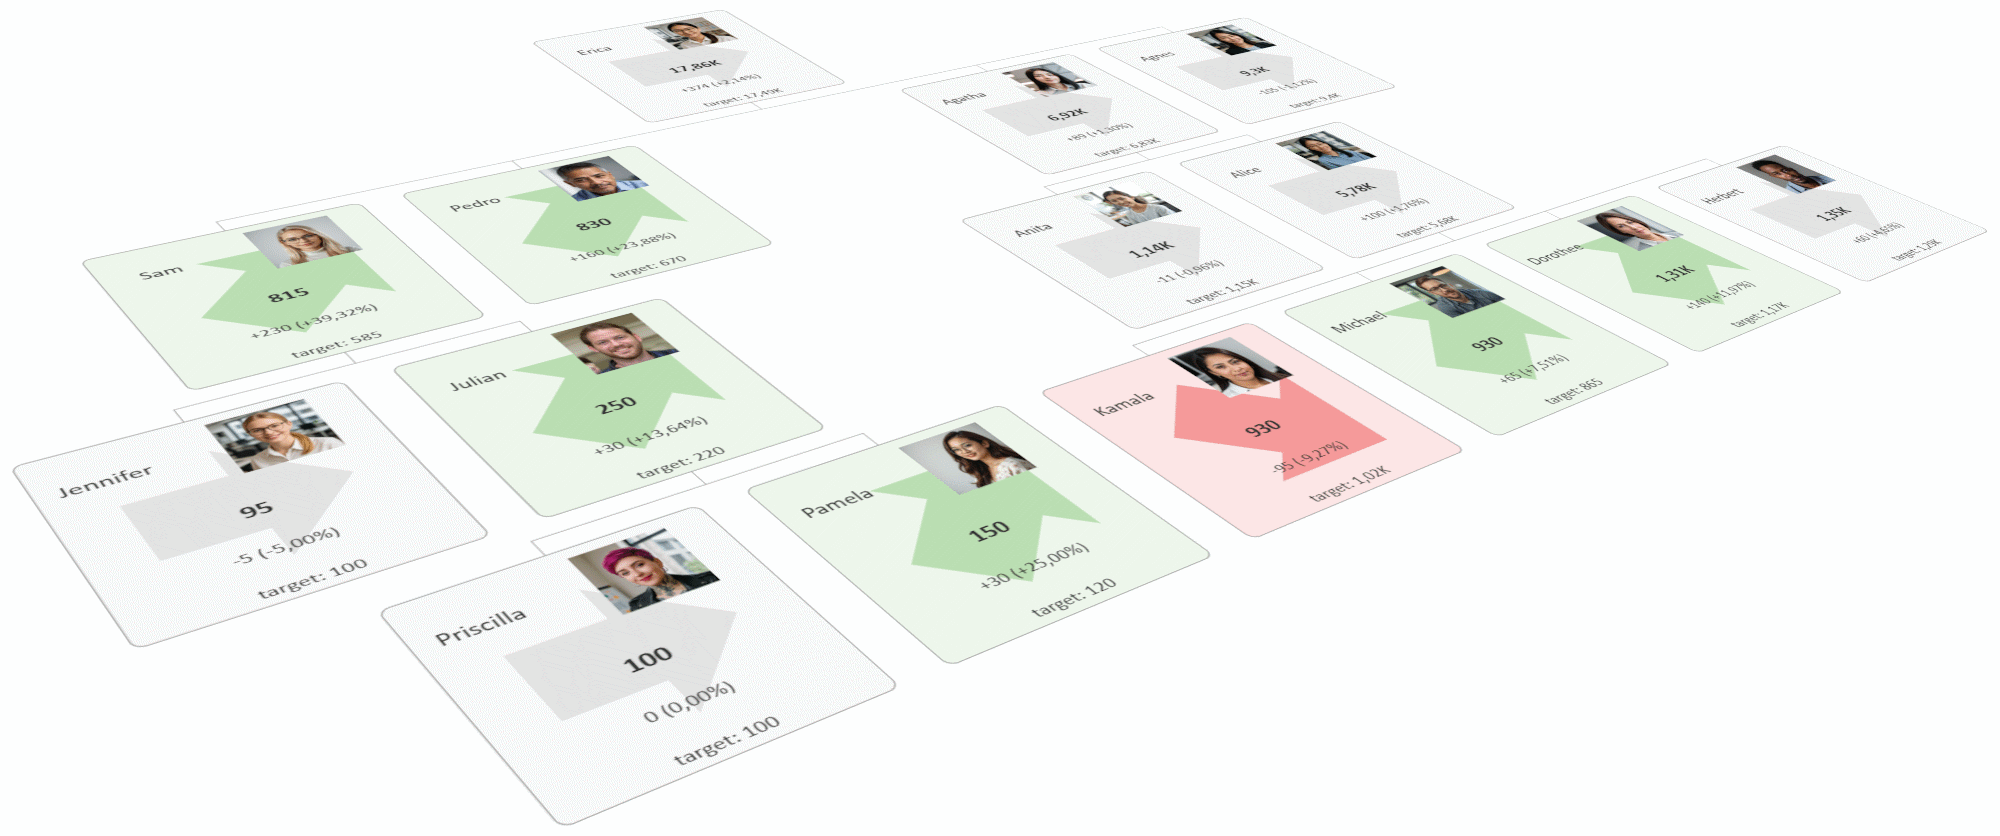
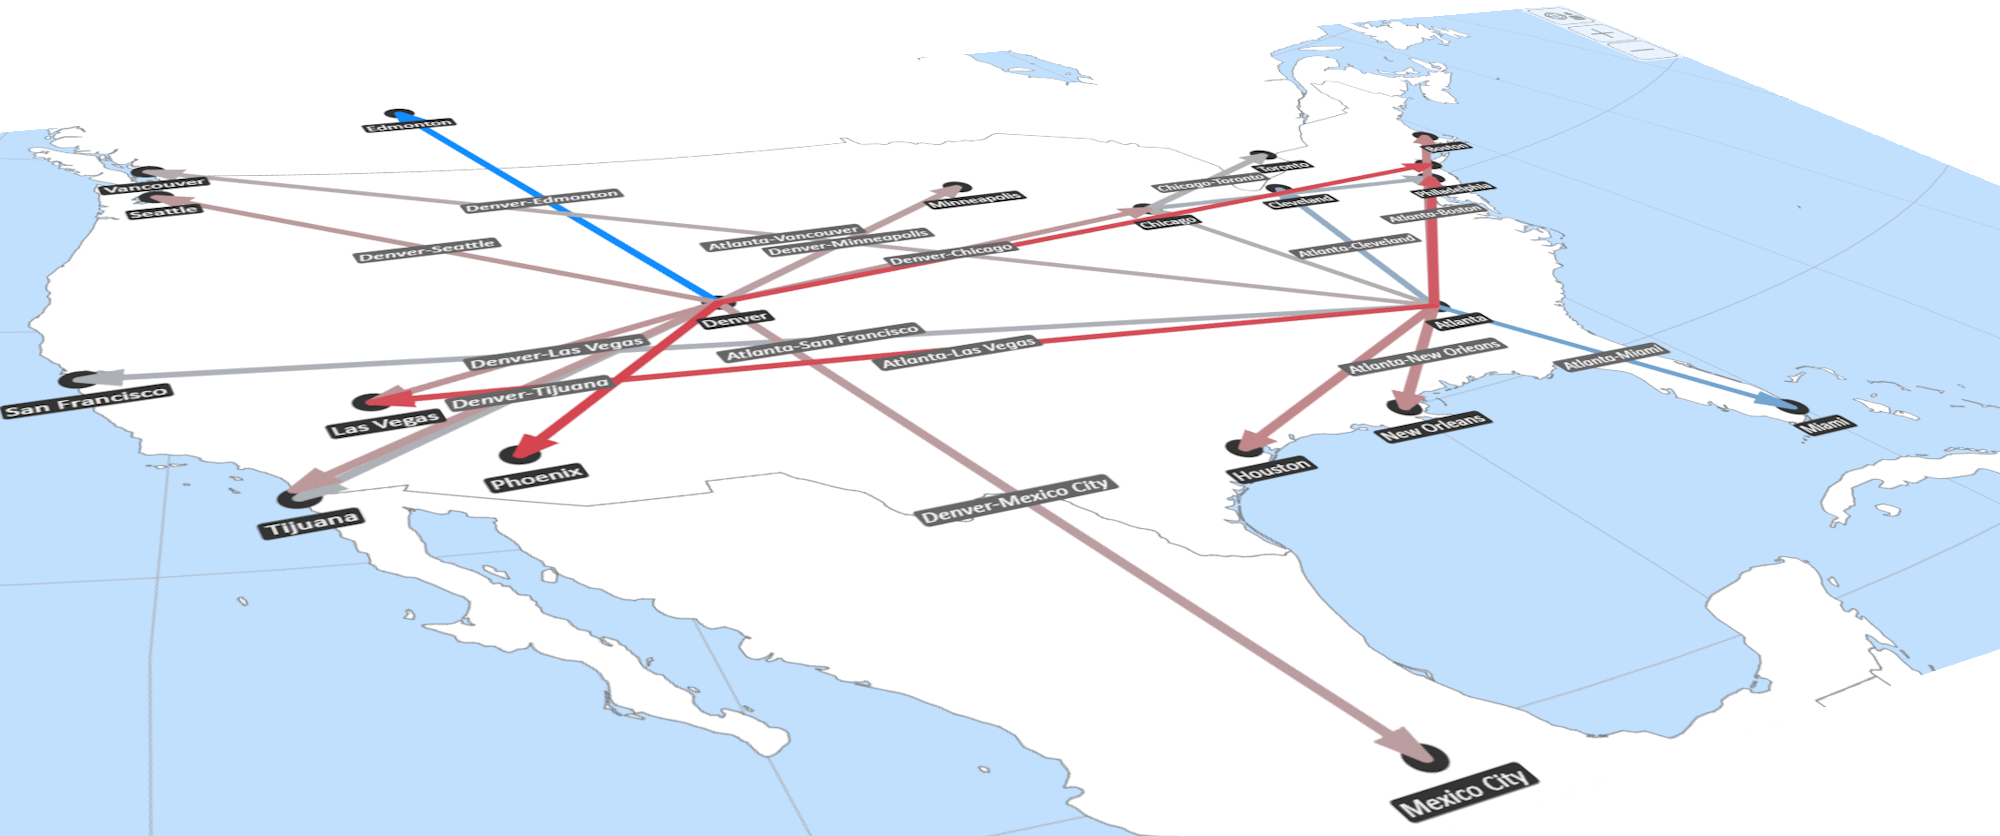
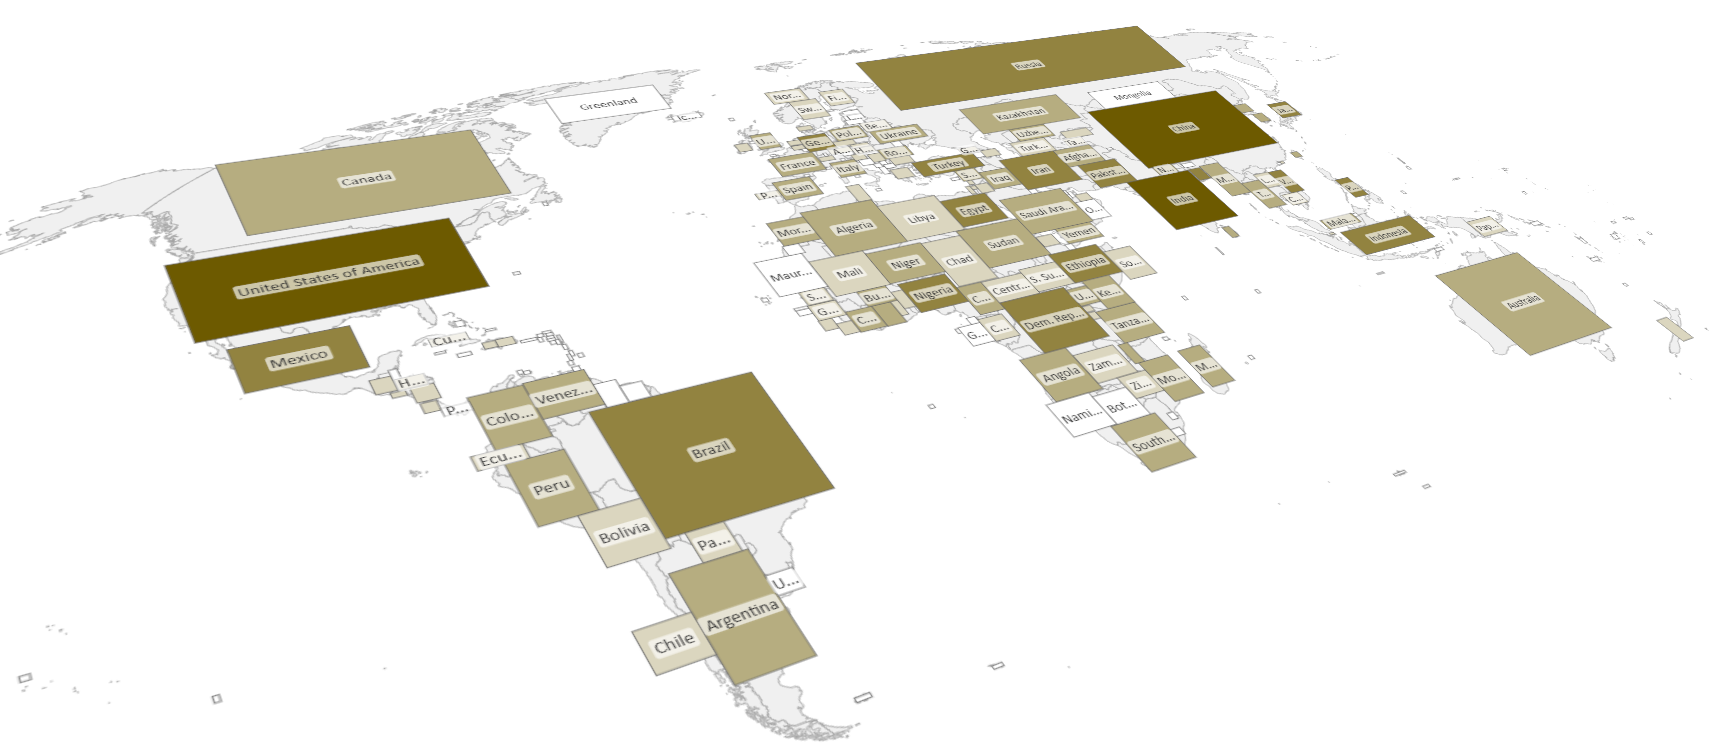
Maximize the potential of Power BI
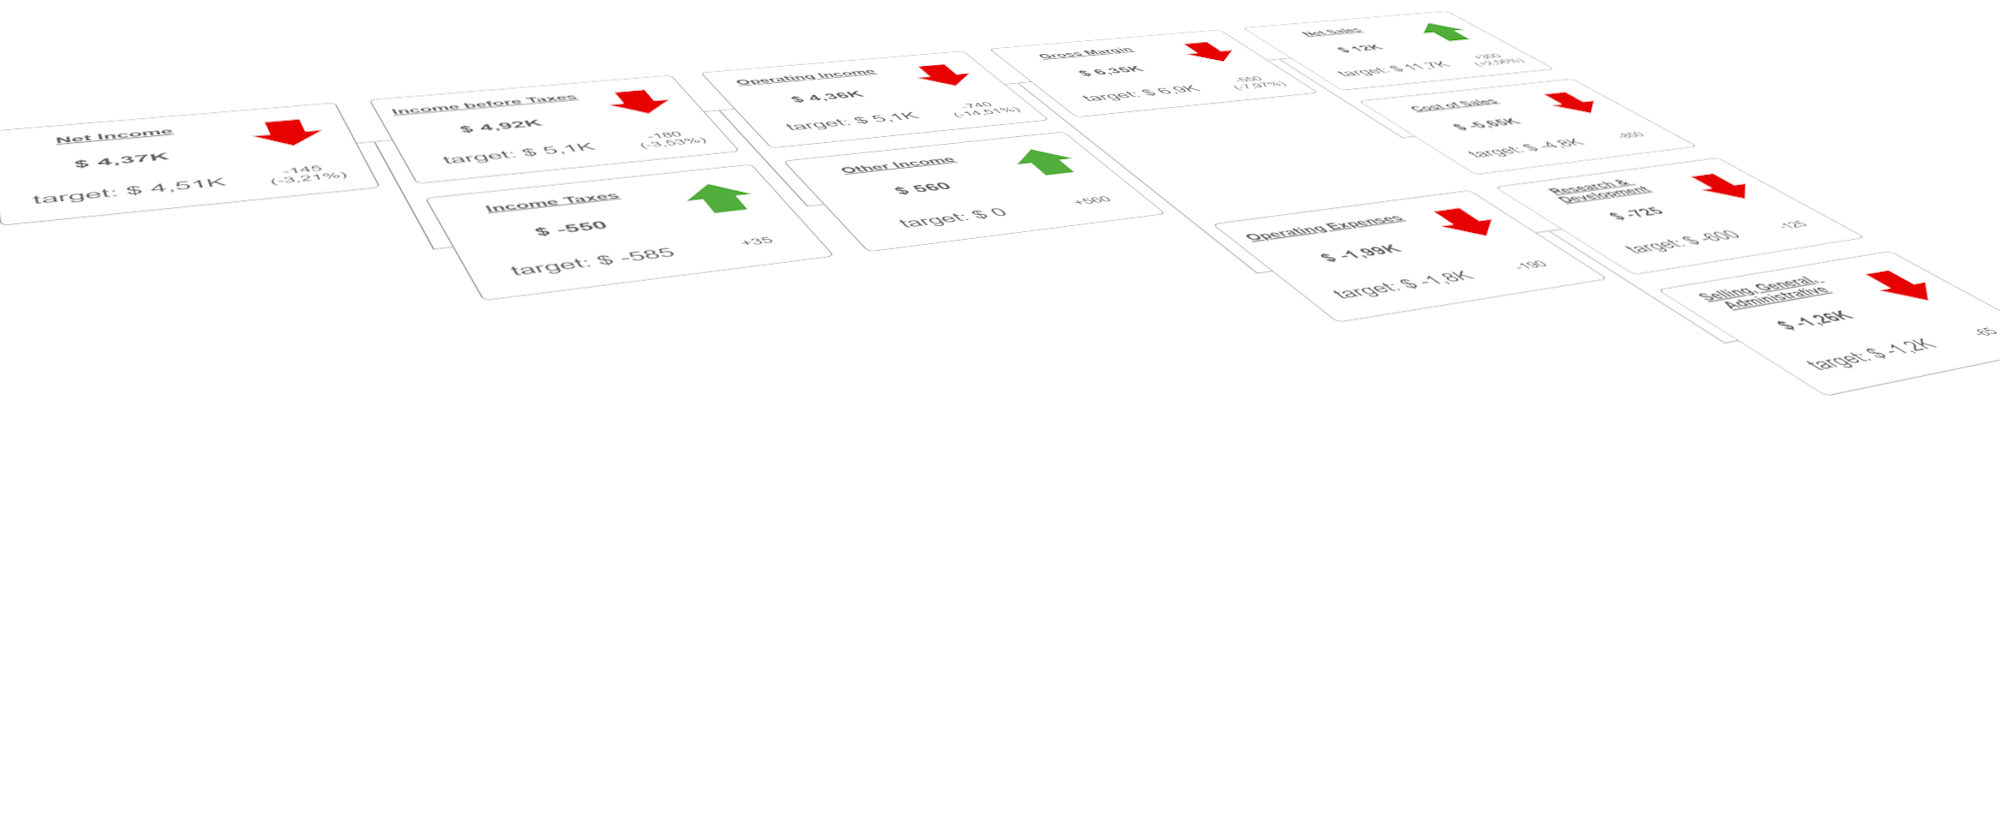
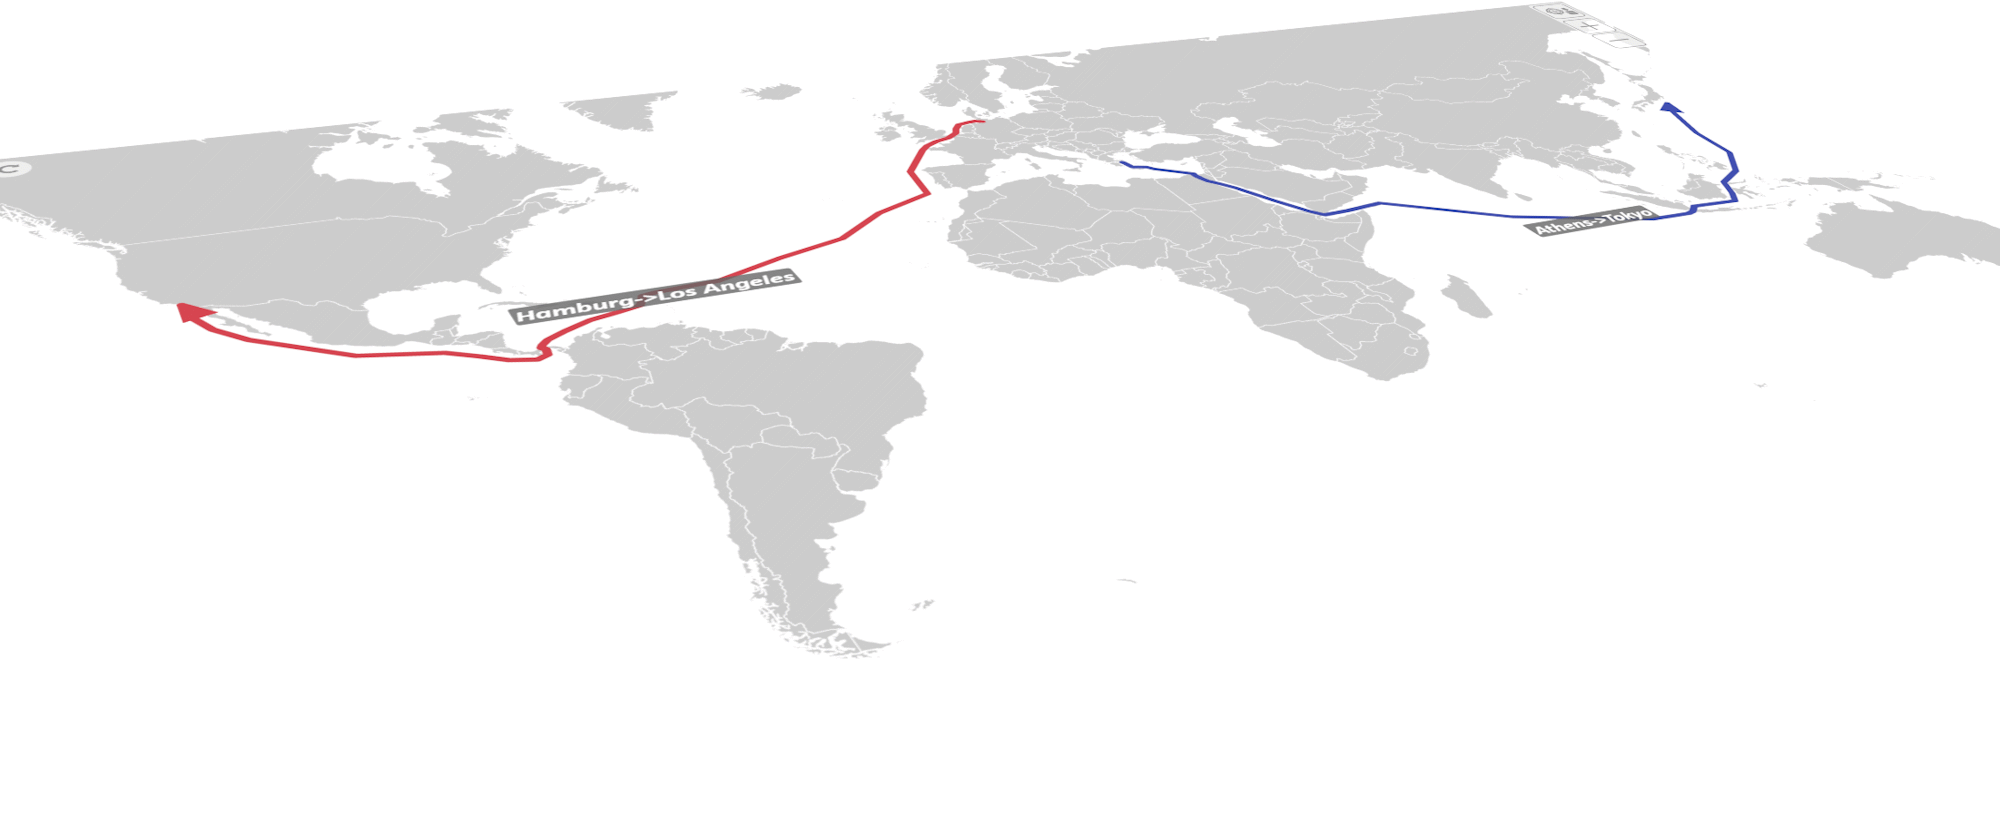
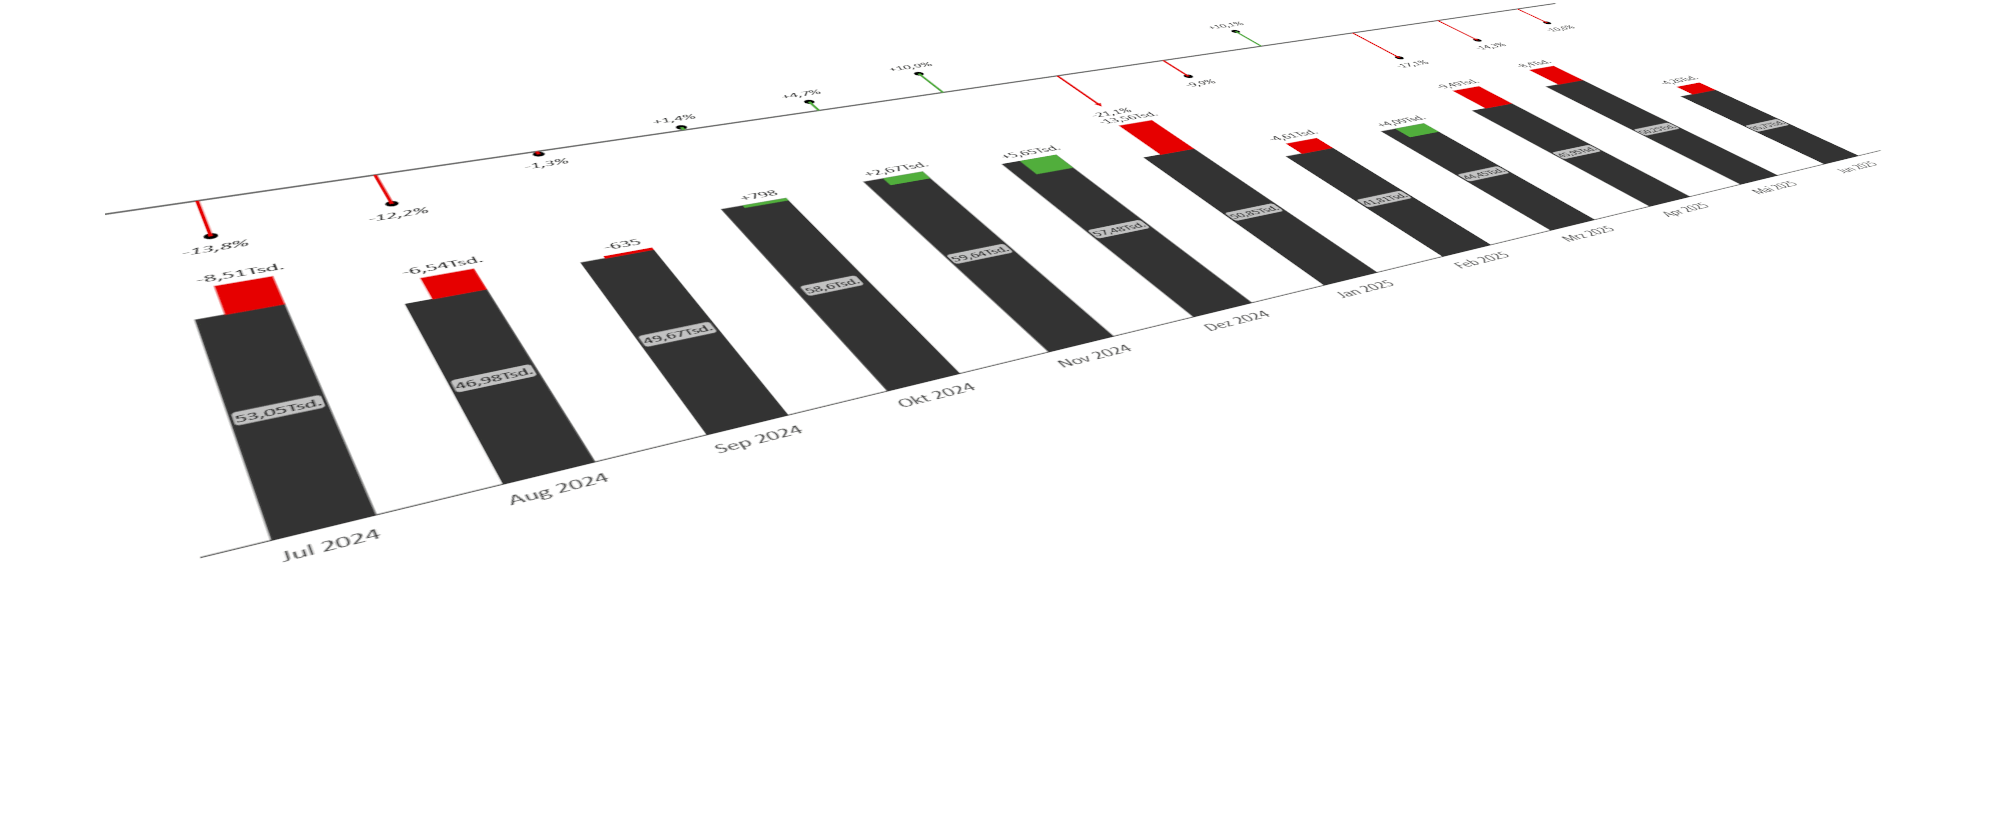
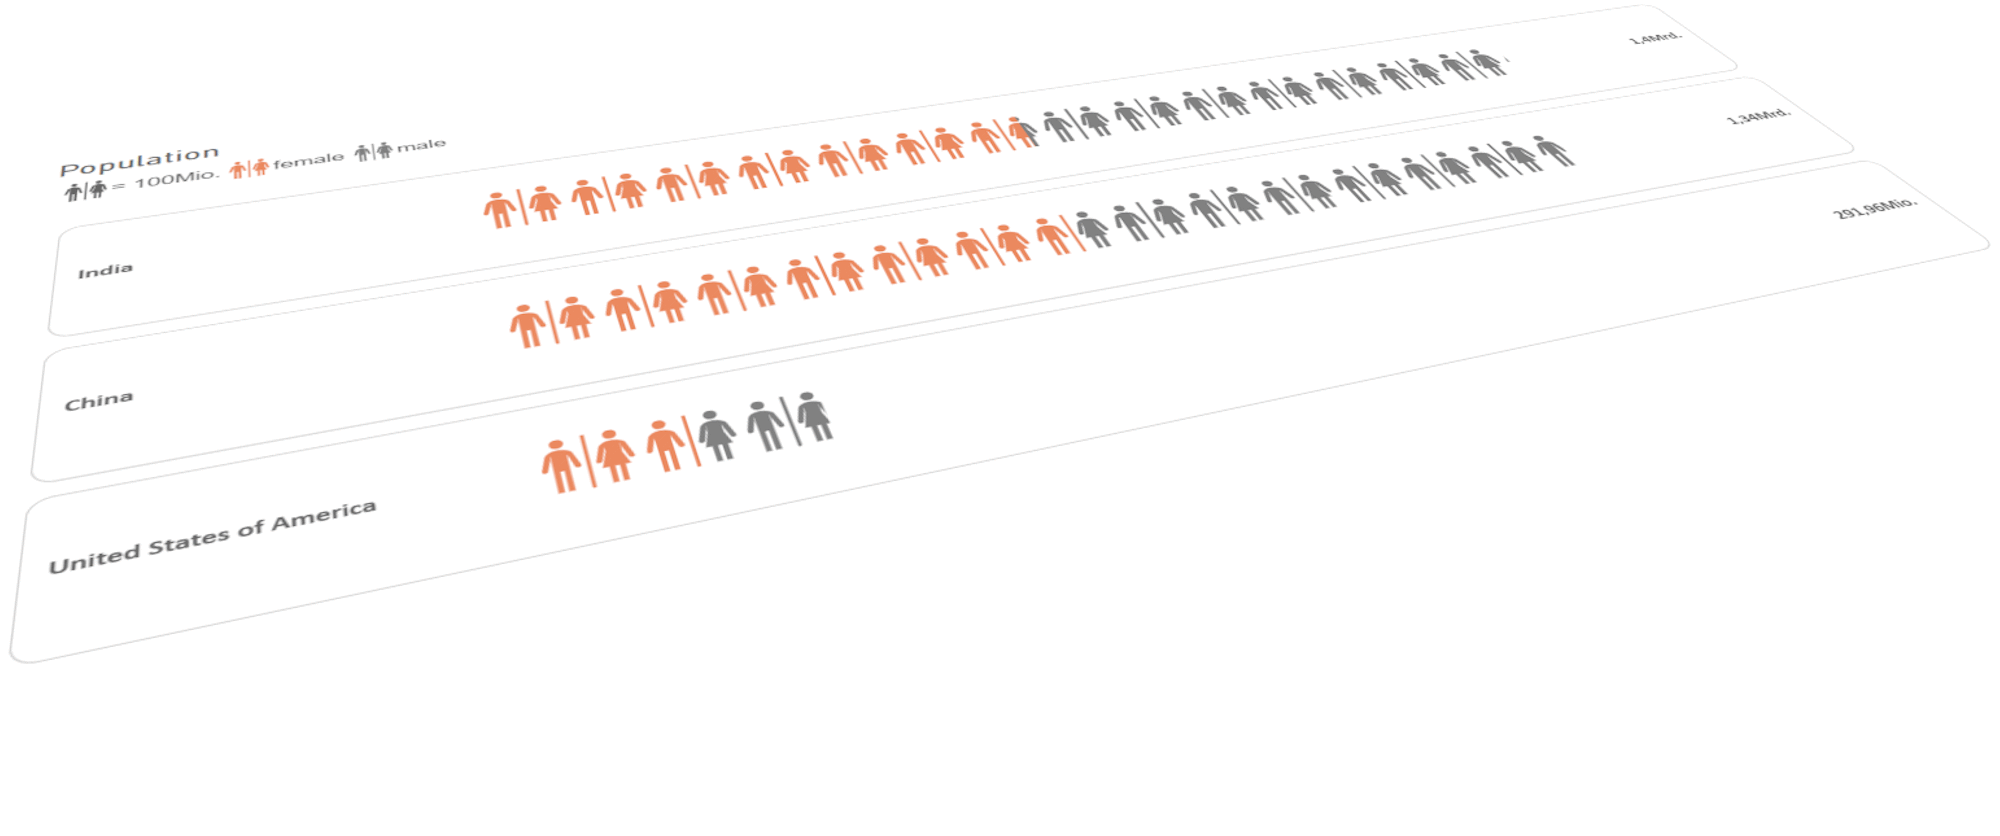
with our custom visuals: Cartogram, KPI Matrix, KPI Tree, Maps, Symbol Chart, and Variance Chart. These tools are designed to provide you with deeper insights and more impactful presentations.
Unlock the full power of your data
with our innovative solutions. Don't settle for ordinary — experience extraordinary.
Contact us: